SAR analysis for monitoring flooding from Hurricane Eta
Analyzing satellite imagery from the past four decades suggests that global warming has increased the chances of storms reaching Category 3 or higher.

Hurricanes have become stronger worldwide during the past four decades, an analysis of observational data shows according to researchers in the National Oceanic and Atmospheric Administration (NOAA), supporting what theory and computer models have long suggested: climate change is making these storms more intense and destructive.
Analyzing satellite imagery from the past four decades suggests that global warming has increased the chances of storms reaching Category 3 or higher. (As reported by a New York Times article)
This reality affects the lives of millions across the globe, a recent example from Central America is Hurricane Iota which became a Category 2 storm on Sunday evening November 15th, 2020 and is quickly gaining strength as it moves closer to Central America and may be at or near Category 4 strength at landfall, according to the latest forecast at the National Hurricane Center.
This storm could bring catastrophic winds, a life-threatening storm surge, and torrential rainfall to a region that is just starting to recover from the devastating Hurricane Eta earlier this month (reported by Orlando Sentinel).
Hurricane Eta was a deadly, erratic, long-lived, and powerful Category 4 hurricane that killed at least 171 people, left 115 people missing, and became the second-most intense November 2020 Atlantic hurricane on record, only behind the 1932 Cuba hurricane.
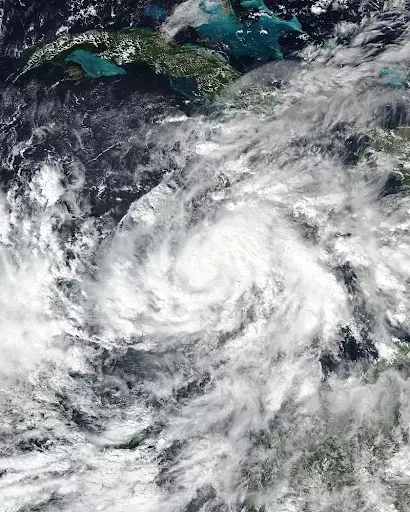
Tropical Storm Eta on November 1, 2020. Credit: NASA – https://worldview.earthdata.nasa.gov/
Hurricane and tropical storm watches and warnings were issued along the coast of Honduras and Northeastern Nicaragua as Eta approached. More than 10,000 people sought refuge at shelters in Puerto Cabezas and surrounding villages. Eta knocked down power lines and trees while damaging roofs and causing wide-scale flooding. Overall, at least 171 fatalities across Central America have been attributed to the storm, including 74 in Honduras, 46 in Guatemala, 27 in Mexico, 19 in Panama, 2 in Nicaragua, 2 in Costa Rica, and 1 in El Salvador.
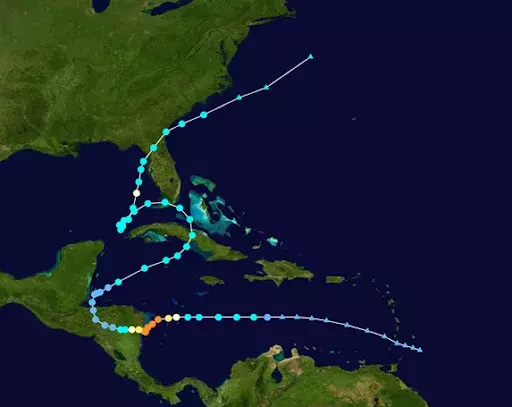
Credit: FleurDeOdile using WikiProject Tropical cyclones/Tracks. The background image is from NASA. Tracking data is from NHC, Public Domain, https://commons.wikimedia.org/w/index.php?curid=95688674
The above track map shows Hurricane Eta in the 2020 Atlantic hurricane season. The points show the location of the storm at 6-hour intervals. The color represents the storm’s maximum sustained wind speeds (Orange is high) as classified in the Saffir–Simpson scale, and the shape of the data points represents the nature of the storm.
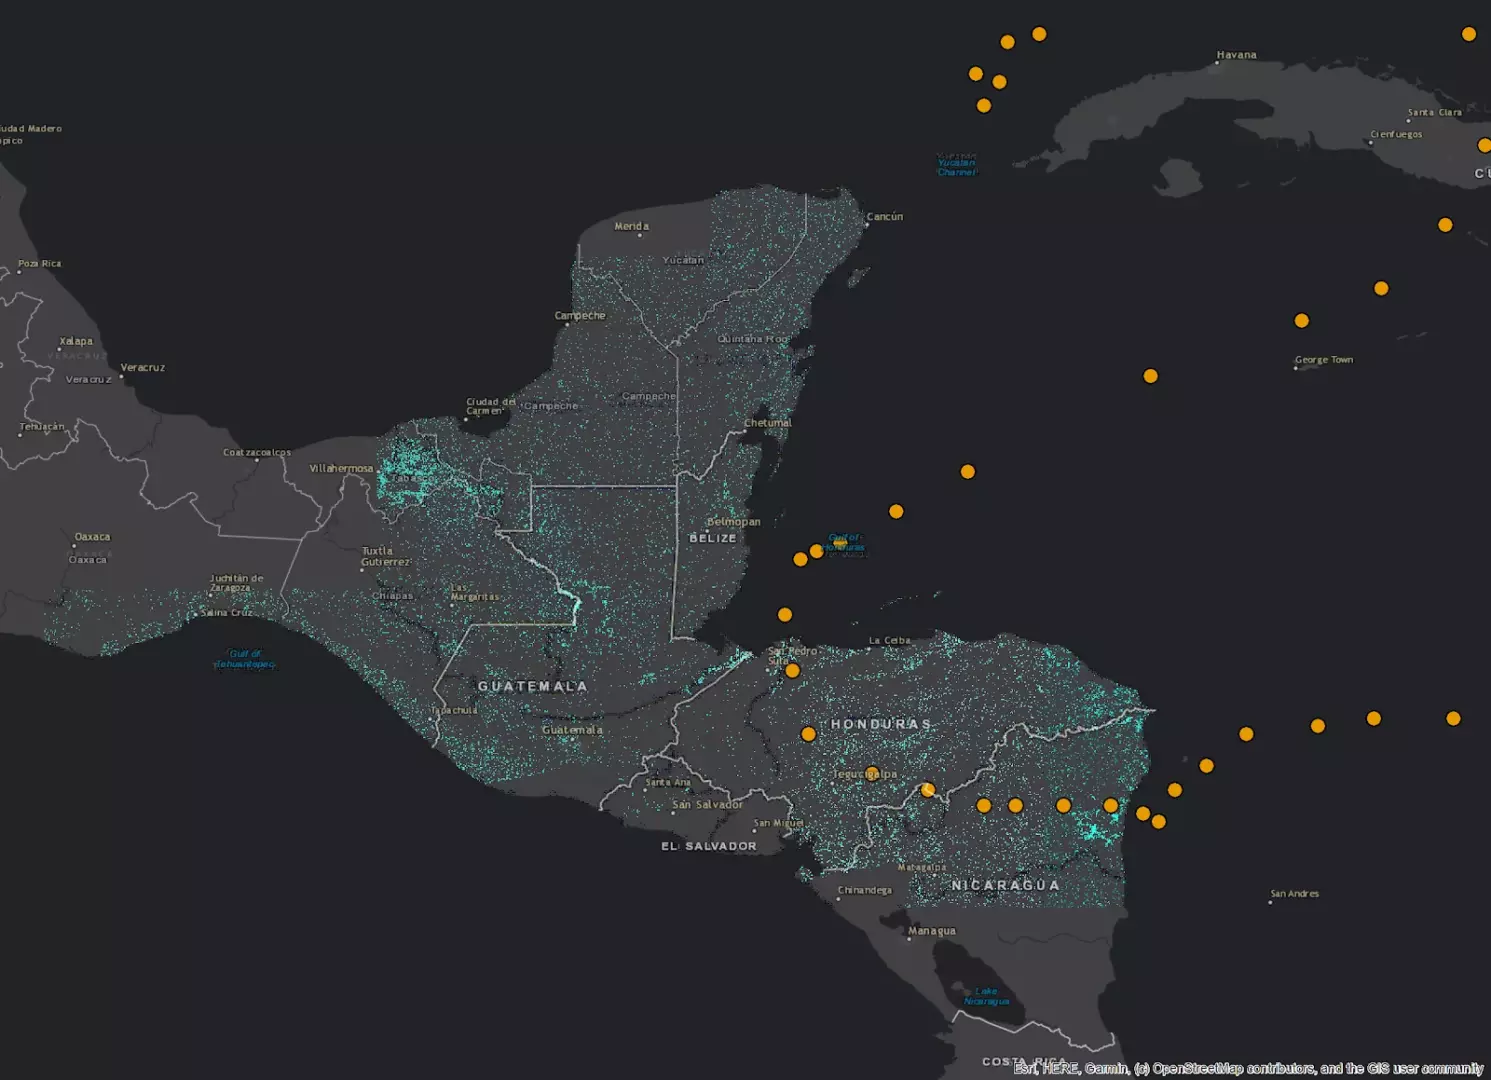
Our analysis of Sentinel-1 Synthetic Aperture Radar data (European Space Agency) captures the scale of flooding that caused by Eta throughout Central America. By analyzing this all-weather data source it is possible to obtain near real-time insights on flooding even through thick cloud cover.
The PlanetWatchers flood map image below illustrates the wide scale of the flooding in Central America. Although it is hard to see details at this scale it is possible to see the general areas that suffered the most from large-scale flooding.
Our estimates calculated that the flooding covered about 7,716 sq km. Our analysis has given us the capability to break this down to show flooded areas by country, shown below.
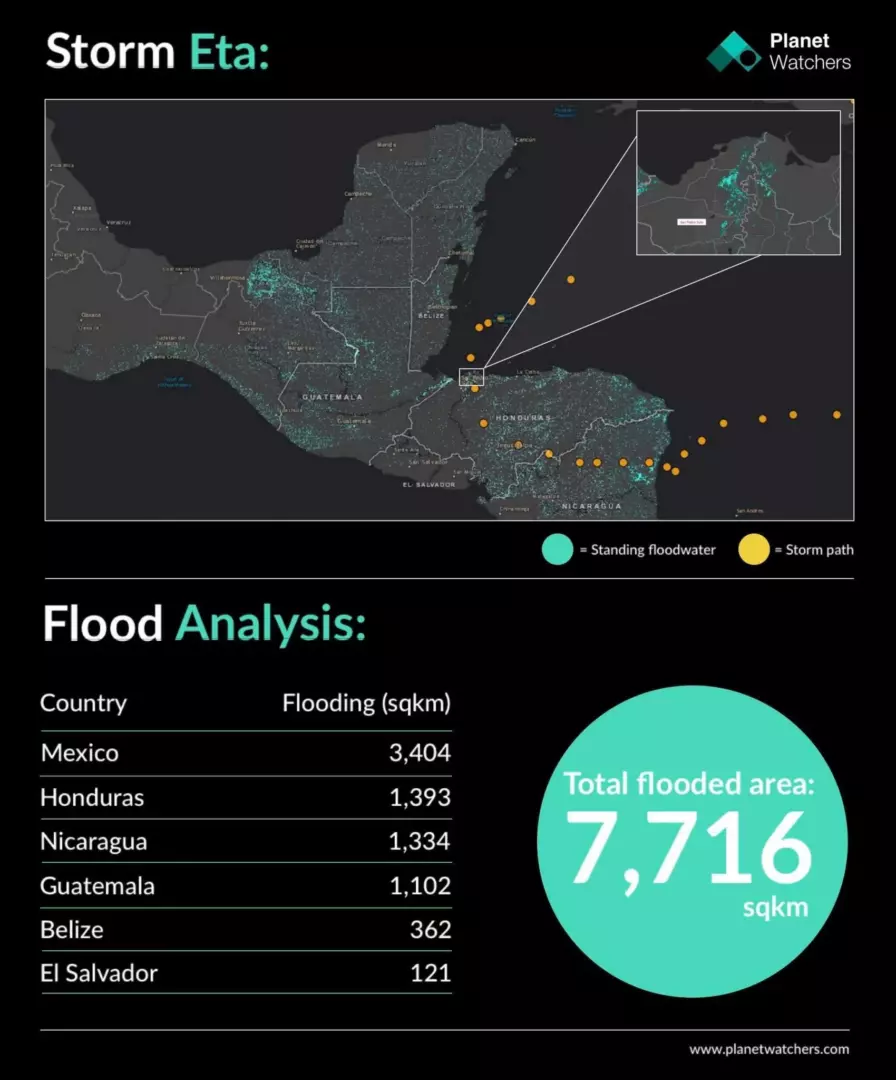
PlanetWatchers flood analysis
Honduras local authorities said they expect the death toll at 74 to go up as flood waters recede and cleanup efforts continue. It’s estimated that Eta caused $5 billion in damages, compared with $2 billion from Hurricane Mitch, “Eta is affecting 25 percent of the population; we’re talking about half a million people. This becomes even more painful because of Covid-19,” said Roberto Contreras to NBC News in Spanish, Roberto was 38 when Mitch devastated Honduras and he is now 60.
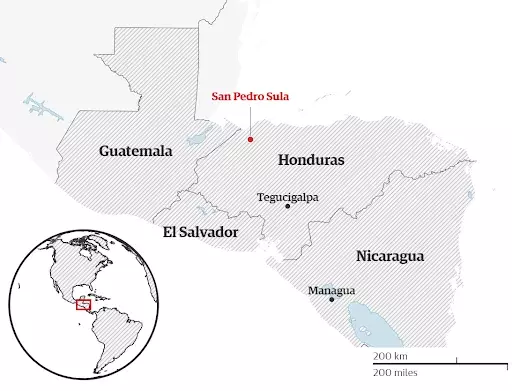
Source and image credit: The Guardian
In the valley surrounding San Pedro Sula, several rivers and flood canals overflowed so high that tens of thousands were trapped for days on rooftops without food or water (see above location image). The total number of victims will likely never be known.

PlanetWatchers flood map (blue) of the San Pedro Sula area. Contains Copernicus data 2020.
Zooming in on our flood map (above) to San Pedro Sula, which was right in the center path of the hurricane, we can see the large-scale flooding in the area as was mapped by our SAR flood mapping SW.
It can be seen that very wide areas were flooded in the San Pedro Sula area. This area is mostly agricultural with many plantations, but there are also many rural communities in the area making the situation very tough.
We continue to monitor hurricane Iota which made landfall over the eastern Nicaraguan coast a few hours ago as a category 4 hurricane. It is now on its way to central-south Honduras and El Salvador.
Our thoughts and prayers are with all of you who are suffering from these devastating weather events and we hope that no more lives will be claimed, we will keep monitoring the area for flooding as the situation unfolds.
Focusing exclusively on crop insurance in North America, PlanetWatchers tells the story of every field saving our customers time and money by enhancing policy and claims validation.